Eleanor Williams, Finance Expert at Moneyfacts, said:
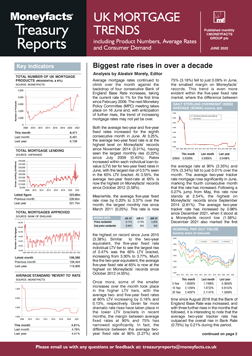
"Between the start of December 2021 and the beginning of June 2022, the Bank of England had raised the base rate by a total of 0.90%. Since then, there have been fluctuations in mortgage product availability, this month dipping by 100 products to leave 4,987 deals for would-be borrowers to choose from. This is a fall of 328 when compared to December 2021, although the level of choice in the market remains up when compared year-on-year. However, our latest data also shows that product shelf-life has fallen back to the record low of 21 days this month, as providers continue to tweak their offerings and condense their ranges in light of an ever-changing economic background, which means that some deals may not be available for long before they are withdrawn or amended.
“The overall two-year tracker rate rose again this month, now 2.54%, which represents a rise of 0.96% when compared to December 2021 and the highest it has been for almost eight years (Sep 2014 – 2.61%). While fixed rate pricing does not automatically shift directly alongside changes in the Bank of England base rate, the overall average two- and five-year fixed rates have also risen notably over this period. At 3.25% and 3.37%, these rates have increased by 0.91% and 0.73% respectively over the past six months. The margin between these two rates is now just 0.12%, the smallest this gap has been since February 2013.
“Average rates for those with higher levels of equity or deposit have seen some of the steepest increases, which may come as a surprise as products at this end of the LTV spectrum have traditionally been priced lower, in part due to the smaller risk of default they tend to pose for providers. At 65% LTV the average two- and five-year fixed rates rose by 0.57% and 0.47% month-on-month to sit at 3.55% and 3.77% respectively – increases of 0.89% and 0.90% compared to the equivalent rates in December 2021, having risen roughly in line with the uplift in the Bank of England base rate over the same period. It is at 60% LTV that we have recorded the largest rate increases in the two- and five-year averages since December 2021. These equivalent rates rose to 2.91% and 3.05% this month, a significant 1.25% and 1.12% above where they sat in December 2021 (1.66% and 1.93% respectively).
“It’s interesting to note that it’s only the 90% and 95% LTV tiers (so often favoured by first-time buyers) where the average two- and five-year fixed rates remain lower now than they were this time last year, which may give hope to those looking to take a step onto the property ladder. While many consumers are battling the ongoing cost of living crisis though, it remains to be seen how any further changes in the market will impact prospective mortgage borrowers.
“The average SVR rate of 4.91% is the highest recorded in over 13 years (February 2009 – 4.94%), having risen by 0.51% since December 2021. The difference between the average SVR and the average two-year fixed rate was 2.06% in December 2021, and over recent months this difference has shrunk to 1.66% as lenders react to a changing economic landscape. However, the motivation to secure a new deal remains clear, as those eligible could still potentially make significant savings, and gain peace of mind with a new fixed deal.”
Eleanor Williams, Finance Expert at Moneyfacts, said:
"Between the start of December 2021 and the beginning of June 2022, the Bank of England had raised the base rate by a total of 0.90%. Since then, there have been fluctuations in mortgage product availability, this month dipping by 100 products to leave 4,987 deals for would-be borrowers to choose from. This is a fall of 328 when compared to December 2021, although the level of choice in the market remains up when compared year-on-year. However, our latest data also shows that product shelf-life has fallen back to the record low of 21 days this month, as providers continue to tweak their offerings and condense their ranges in light of an ever-changing economic background, which means that some deals may not be available for long before they are withdrawn or amended.
“The overall two-year tracker rate rose again this month, now 2.54%, which represents a rise of 0.96% when compared to December 2021 and the highest it has been for almost eight years (Sep 2014 – 2.61%). While fixed rate pricing does not automatically shift directly alongside changes in the Bank of England base rate, the overall average two- and five-year fixed rates have also risen notably over this period. At 3.25% and 3.37%, these rates have increased by 0.91% and 0.73% respectively over the past six months. The margin between these two rates is now just 0.12%, the smallest this gap has been since February 2013.
“Average rates for those with higher levels of equity or deposit have seen some of the steepest increases, which may come as a surprise as products at this end of the LTV spectrum have traditionally been priced lower, in part due to the smaller risk of default they tend to pose for providers. At 65% LTV the average two- and five-year fixed rates rose by 0.57% and 0.47% month-on-month to sit at 3.55% and 3.77% respectively – increases of 0.89% and 0.90% compared to the equivalent rates in December 2021, having risen roughly in line with the uplift in the Bank of England base rate over the same period. It is at 60% LTV that we have recorded the largest rate increases in the two- and five-year averages since December 2021. These equivalent rates rose to 2.91% and 3.05% this month, a significant 1.25% and 1.12% above where they sat in December 2021 (1.66% and 1.93% respectively).
“It’s interesting to note that it’s only the 90% and 95% LTV tiers (so often favoured by first-time buyers) where the average two- and five-year fixed rates remain lower now than they were this time last year, which may give hope to those looking to take a step onto the property ladder. While many consumers are battling the ongoing cost of living crisis though, it remains to be seen how any further changes in the market will impact prospective mortgage borrowers.
“The average SVR rate of 4.91% is the highest recorded in over 13 years (February 2009 – 4.94%), having risen by 0.51% since December 2021. The difference between the average SVR and the average two-year fixed rate was 2.06% in December 2021, and over recent months this difference has shrunk to 1.66% as lenders react to a changing economic landscape. However, the motivation to secure a new deal remains clear, as those eligible could still potentially make significant savings, and gain peace of mind with a new fixed deal.”