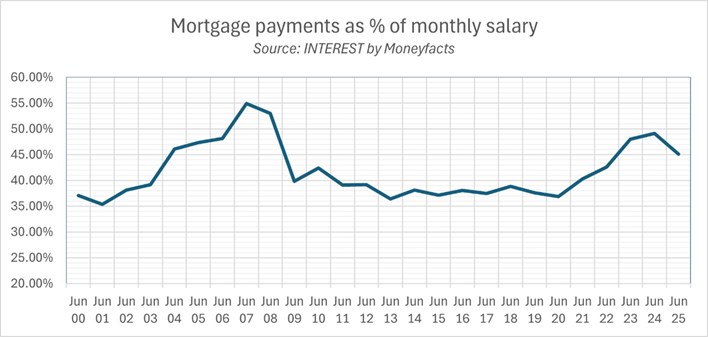
Monthly mortgage repayments toughest burden since 2008 financial crisis
With softening house price growth and an ongoing debate about property tax reform, exclusive analysis from INTEREST by Moneyfacts reveals the burden mortgage payments are putting on household finances.
- An average earner able to put down the required deposit and commit to a mortgage in the past couple of years will have found their monthly mortgage payment is close to half of their gross salary, the toughest burden since the 2008 financial crisis.
- At the turn of the millennium, the average house price was £78,000, around five times the average wage of £15,800. In 2025 the average house price is £269,000, around seven times the average wage of £37,600 - well above standard lending caps.
- Since 2000, wages have risen 237% while house prices have increased 345%.
- If wages had increased at the same rate as house prices since 2000, the average UK salary would be over £54,000 in 2025. In fact, house price inflation has far outpaced the rise in most household goods during this time. A loaf of bread would cost around £2.28 today based on house price inflation, while a dozen eggs would cost £4.73.
- An average homebuyer could save about £100 per month by securing one of today’s lowest two-year fixed mortgage rates on the market, at 90% loan-to-value, which is around 4.20% compared to June’s average rate of 5.12%. However, this would still account for roughly 38% of their gross monthly income, a similar level to what homeowners were paying back in June 2018 at average rates.
Adam French, Head of News at Moneyfacts, said:
“Affordability may have eased a touch over the past 12 months, but buying a home in 2025 is still too much of a financial stretch for many. Putting aside the not inconsiderable tasks of affording rapidly rising rent costs and saving a sizeable deposit, monthly mortgage repayments are eating up almost half of gross earnings – the toughest burden since the 2008 financial crisis.
“Years of ultra-low borrowing costs, Government incentives and a lack of housing supply have driven house prices far ahead of wages, leaving many buyers caught between high prices, expensive borrowing and strict lending rules. It all means that a typical borrower today will need to take a mortgage over a 50-year term to keep their repayments to a more affordable 35% of gross monthly income.
“There remains an acute risk that the market could overcorrect or overheat depending on the future path of interest rates, inflation and wage growth despite a recent softening of house price growth. We now need a period of stability where modest house price growth allows incomes to catch up so the market can return to more sustainable levels that benefit homeowners, homebuyers and the wider economy. In the meantime, it may mean holding rates where they are until inflation is in check is what is needed to nip another boom-and-bust cycle in the bud.”
|
Month/Year
|
Average monthly earnings (gross)
|
Average house price
|
Moneyfacts Average Mortgage Rate
|
Average Monthly mortgage payment*
|
% share of gross monthly salary
|
|
Jun 2000
|
£1,345.50
|
£82,197.00
|
6.57%
|
£499.00
|
37.09%
|
|
Jun 2001
|
£1,423.21
|
£88,892.00
|
5.71%
|
£503.00
|
35.34%
|
|
Jun 2002
|
£1,475.30
|
£104,372.00
|
5.33%
|
£563.00
|
38.16%
|
|
Jun 2003
|
£1,513.27
|
£118,444.00
|
4.54%
|
£593.00
|
39.19%
|
|
Jun 2004
|
£1,576.33
|
£134,845.00
|
5.29%
|
£727.00
|
46.12%
|
|
Jun 2005
|
£1,645.42
|
£144,410.00
|
5.17%
|
£779.00
|
47.34%
|
|
Jun 2006
|
£1,736.38
|
£154,927.00
|
5.18%
|
£836.00
|
48.15%
|
|
Jun 2007
|
£1,811.63
|
£171,659.00
|
5.88%
|
£995.00
|
54.92%
|
|
Jun 2008
|
£1,874.73
|
£167,498.00
|
6.31%
|
£994.00
|
53.02%
|
|
Jun 2009
|
£1,896.62
|
£146,984.00
|
3.73%
|
£756.00
|
39.86%
|
|
Jun 2010
|
£1,914.55
|
£158,155.00
|
4.74%
|
£812.00
|
42.41%
|
|
Jun 2011
|
£1,974.68
|
£154,530.00
|
4.49%
|
£773.00
|
39.15%
|
|
Jun 2012
|
£1,999.80
|
£156,645.00
|
4.62%
|
£784.00
|
39.20%
|
|
Jun 2013
|
£2,020.88
|
£159,045.00
|
3.75%
|
£736.00
|
36.42%
|
|
Jun 2014
|
£2,035.52
|
£172,331.00
|
3.62%
|
£776.00
|
38.12%
|
|
Jun 2015
|
£2,083.19
|
£181,289.00
|
3.02%
|
£774.00
|
37.15%
|
|
Jun 2016
|
£2,136.65
|
£196,106.00
|
2.81%
|
£814.00
|
38.10%
|
|
Jun 2017
|
£2,201.57
|
£204,347.00
|
2.53%
|
£825.00
|
37.47%
|
|
Jun 2018
|
£2,248.68
|
£210,355.00
|
2.66%
|
£873.00
|
38.82%
|
|
Jun 2019
|
£2,338.11
|
£211,915.00
|
2.65%
|
£880.00
|
37.64%
|
|
Jun 2020
|
£2,303.31
|
£216,208.00
|
2.17%
|
£849.00
|
36.86%
|
|
Jun 2021
|
£2,502.35
|
£242,777.00
|
2.72%
|
£1,008.00
|
40.28%
|
|
Jun 2022
|
£2,658.87
|
£258,118.00
|
3.30%
|
£1,132.00
|
42.57%
|
|
Jun 2023
|
£2,901.88
|
£258,275.00
|
5.34%
|
£1,393.00
|
48.00%
|
|
Jun 2024
|
£2,993.35
|
£259,605.00
|
5.76%
|
£1,470.00
|
49.11%
|
|
Jun 2025
|
£3,138.69
|
£269,079.00
|
5.12%
|
£1,416.00
|
45.11%
|
Sources: Moneyfacts Analyser, ONS & Land Registry
*Capital repayment mortgage over 25 years with a 10% deposit using the Bank of England borrowing calculator
Read more in the latest issue of the INTEREST journal, which you can read for free here. Part or all of this press release can be reproduced, so long as we are sufficiently sourced.
- ENDS
Adam French
Head of News & Communications
T: 01603 476154
M: 07872 543262
E: afrench@moneyfacts.co.uk
INTEREST is dispatched in advance of meetings of The Bank of England’s Monetary Policy Committee and is distributed free of charge. Next Issue Friday 5 September. To receive the latest issue and sign up please visit: https://www.moneyfactsgroup.co.uk/magazines-and-reports/interest/
Have an opinion? Letters to the Editor invited:
interest@moneyfacts.co.uk