Brand Logo Moneyfacts Group plc
Telephone Icon T: 01603 476476 Email Icon E: enquiries@moneyfacts.co.uk LinkedIn Icon

Lenders drive down fixed rates and relax stress tests

Image of a Moneyfacts Mortgage Treasury Report Image of a Moneyfacts Mortgage Treasury Report Image of a Moneyfacts Mortgage Treasury Report
Rachel Springall, Press Officer
Rachel Springall, Press Officer / Finance Expert 01603 476210 Email Rachel
07/07/2025

Lenders drive down fixed rates and relax stress tests

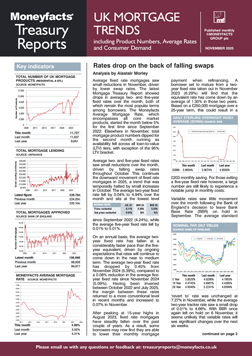
Moneyfacts UK Mortgage Trends Treasury Report data reveals the average two- and five-year fixed rates continued on the downward trend, as lenders also relaxed stress tests. Mortgage product availability rose and the average shelf-life of a deal fell to 16 days.


  • Average mortgage rates on the overall two- and five-year fixed rates fell by 0.03% and 0.01% to 5.09% and 5.08%, respectively.
  • The average two- and five-year fixed rates were last lower in September 2022 (4.24%) and October 2024 (5.07%) respectively.
  • At the start of July 2024, the average five-year fixed rate was 5.53%; compared to the start of this month, the rate is 0.45% lower at 5.08%. However, the average two-year fixed rate has fallen by 0.86% over the same period, down from 5.95% to 5.09%.
  • The average two-year fixed rate is 0.01% higher than the five-year equivalent but this is the lowest the gap has been since rates became inverted in October 2022.
  • The Moneyfacts Average Mortgage Rate fell to 5.11%, down from 5.12% month-on-month. It is down from 5.80% since July 2024, and lower than 6.17% in July 2023.
  • The average shelf-life of a mortgage product fell to 16 days, from 17 days a month ago, now at its lowest count since March 2025 (16 days).
  • Product choice overall rose month-on-month, to 6,908 options, up year-on-year (6,658 – July 2024), outside of May 2025 (6,993), this was last higher in October 2007 (7,421).
  • The average two-year tracker variable mortgage rate remained unchanged at 4.91%.
  • The average ‘revert to’ rate or Standard Variable Rate (SVR) fell to 7.42%. In comparison, the highest recorded was 8.19% during November and December 2023.


Mortgage market analysis


Jul-23

Jul-24

Jan-25

Jun -25

Jul-25

Fixed and variable rate products

Total product count - all LTVs

4,396

6,658

6,508

6,843

6,908

Product count - 95% LTV

188

361

366

453

447

Product count - 90% LTV

525

792

759

873

856

Product count - 60% LTV

511

741

780

793

800

All products

Shelf-life (days)

12

30

21

17

16

All LTVs

Average two-year fixed rate

6.41%

5.95%

5.48%

5.12%

5.09%

Average five-year fixed rate

5.97%

5.53%

5.25%

5.09%

5.08%

95% LTV

Average two-year fixed rate

6.80%

6.26%

5.86%

5.57%

5.54%

Average five-year fixed rate

6.01%

5.78%

5.47%

5.52%

5.50%

90% LTV

Average two-year fixed rate

6.39%

6.18%

5.75%

5.38%

5.32%

Average five-year fixed rate

5.81%

5.64%

5.36%

5.21%

5.17%

60% LTV

Average two-year fixed rate

6.15%

5.45%

4.96%

4.58%

4.57%

Average five-year fixed rate

5.74%

5.06%

4.79%

4.65%

4.68%

All LTVs

Standard Variable Rate (SVR)

7.67%

8.17%

7.81%

7.48%

7.42%

All LTVs

Average two-year tracker rate

5.96%

5.94%

5.47%

4.91%

4.91%

Data shown is as at the first available day of the month, unless stated otherwise.

Source: Moneyfacts Treasury Reports


Moneyfacts Average Mortgage Rate


Jul-23

Jul-24

Jan-25

Jun-25

Jul-25

Moneyfacts Average Mortgage Rate

6.17%

5.80%

5.40%

5.12%

5.11%

Calculated from the total of all on-sale, core market, fixed and variable tracker mortgages. Standard exclusions apply: Self-build only, shared ownership only, new build only, shared equity only, standard variable rates and adverse credit

Source: Moneyfacts Average Mortgage Rate.


Rachel Springall, Finance Expert at Moneyfacts, said:

“Fixed mortgage rates have continued on their downward trend, which will delight the millions of borrowers due to refinance this year. Lenders have also been relaxing their stress test rules, which will further boost affordability. The repricing momentum from lenders was rife in June, leading to another fall in the average shelf-life of a deal to 16 days. However, the intensity of fixed rate cuts calmed, seeing the average two- and five-year fixed rates drop by 0.03% and 0.01%, respectively. A deeper dive into the loan-to-value (LTV) sectors also revealed the average five-year fixed rate at 60% loan-to-value rose, and with the five-year fixed rate dropping by just 0.01%, it may raise concerns over the diverging path of longer-term fixed rates. There are expectations for fixed rate cuts to heat up this summer across the spectrum, fuelled by swap rate volatility. The mortgage market has shown how far it has improved over recent years, as borrowers who locked into a two-year fixed rate deal back in July 2023 would have been paying 6.41% in interest on average, compared to 5.09% now. That is a difference of £199 per month in repayments on a £250,000 mortgage over 25 years.

“The growth in overall product availability creates a positive sentiment, and reaffirms the more calming churn of mortgage ranges by lenders. This stance is far beyond the upheaval endured by the mortgage market two years ago, when there was a drop of 571 products between the start of June and July 2023, the biggest plummet since the ‘mini-Budget’ which caused unprecedented chaos around both product choice and mortgage interest rates. Borrowers will not want to see a repeat of such upheaval, especially first-time buyers. Those worried about the end of the Mortgage Guarantee Scheme will find negligible impact in the choice of mortgages at higher LTVs, and the Government is due to announce a new replacement this month. In the meantime, the calls for lenders to do more have not been ignored, with relaxation in stress tests underway, but there is still no news on changing the loan-to-income (LTI) rules. There needs to be more progress to support first-time buyers, who remain the lifeblood of the mortgage market and to get mortgage prisoners switching deals. It is essential borrowers seek advice to navigate the latest deals available to them.”


Notes to editors

You are welcome to use part or all of this press release, so long as we are sufficiently sourced. We would appreciate a link back to Moneyfactsgroup.co.uk.

Pioneering financial comparison technology for over 35 years, Moneyfacts Group plc is the UK’s leading provider of retail financial product data. Used by virtually every bank and building society in the UK, and supplied to the Bank of England, Financial Conduct Authority, Financial Ombudsman Service, HM Treasury, Prudential Regulatory Authority and UK Finance.

Our expert research team monitors the thousands of mortgages, savings, credit card, personal loan, banking, life, pension and investment products in the UK.

For more information about us please see our key facts.

Broadcast

Our broadcast suite enables our finance experts to appear in-vision for television, and we regularly comment live on national and regional radio.

To arrange an interview for radio or television, please contact our press department. We have an in-house broadcast room.


Contact Us If you're looking for extra comment, a chart or more information, then please give us a call. We are always more than happy to help.
Adam French Head of News & Communications
Rachel Springall Press Officer / Finance Expert
Caitlyn Eastell Press & PR Executive